Blinkit Sales Analytics Dashboard
Power BIDAXQuick-Commerce Analytics
The Problem
Blinkit required detailed insights into simulated sales data across various outlet types and categories to optimize their quick-commerce model.
The Approach
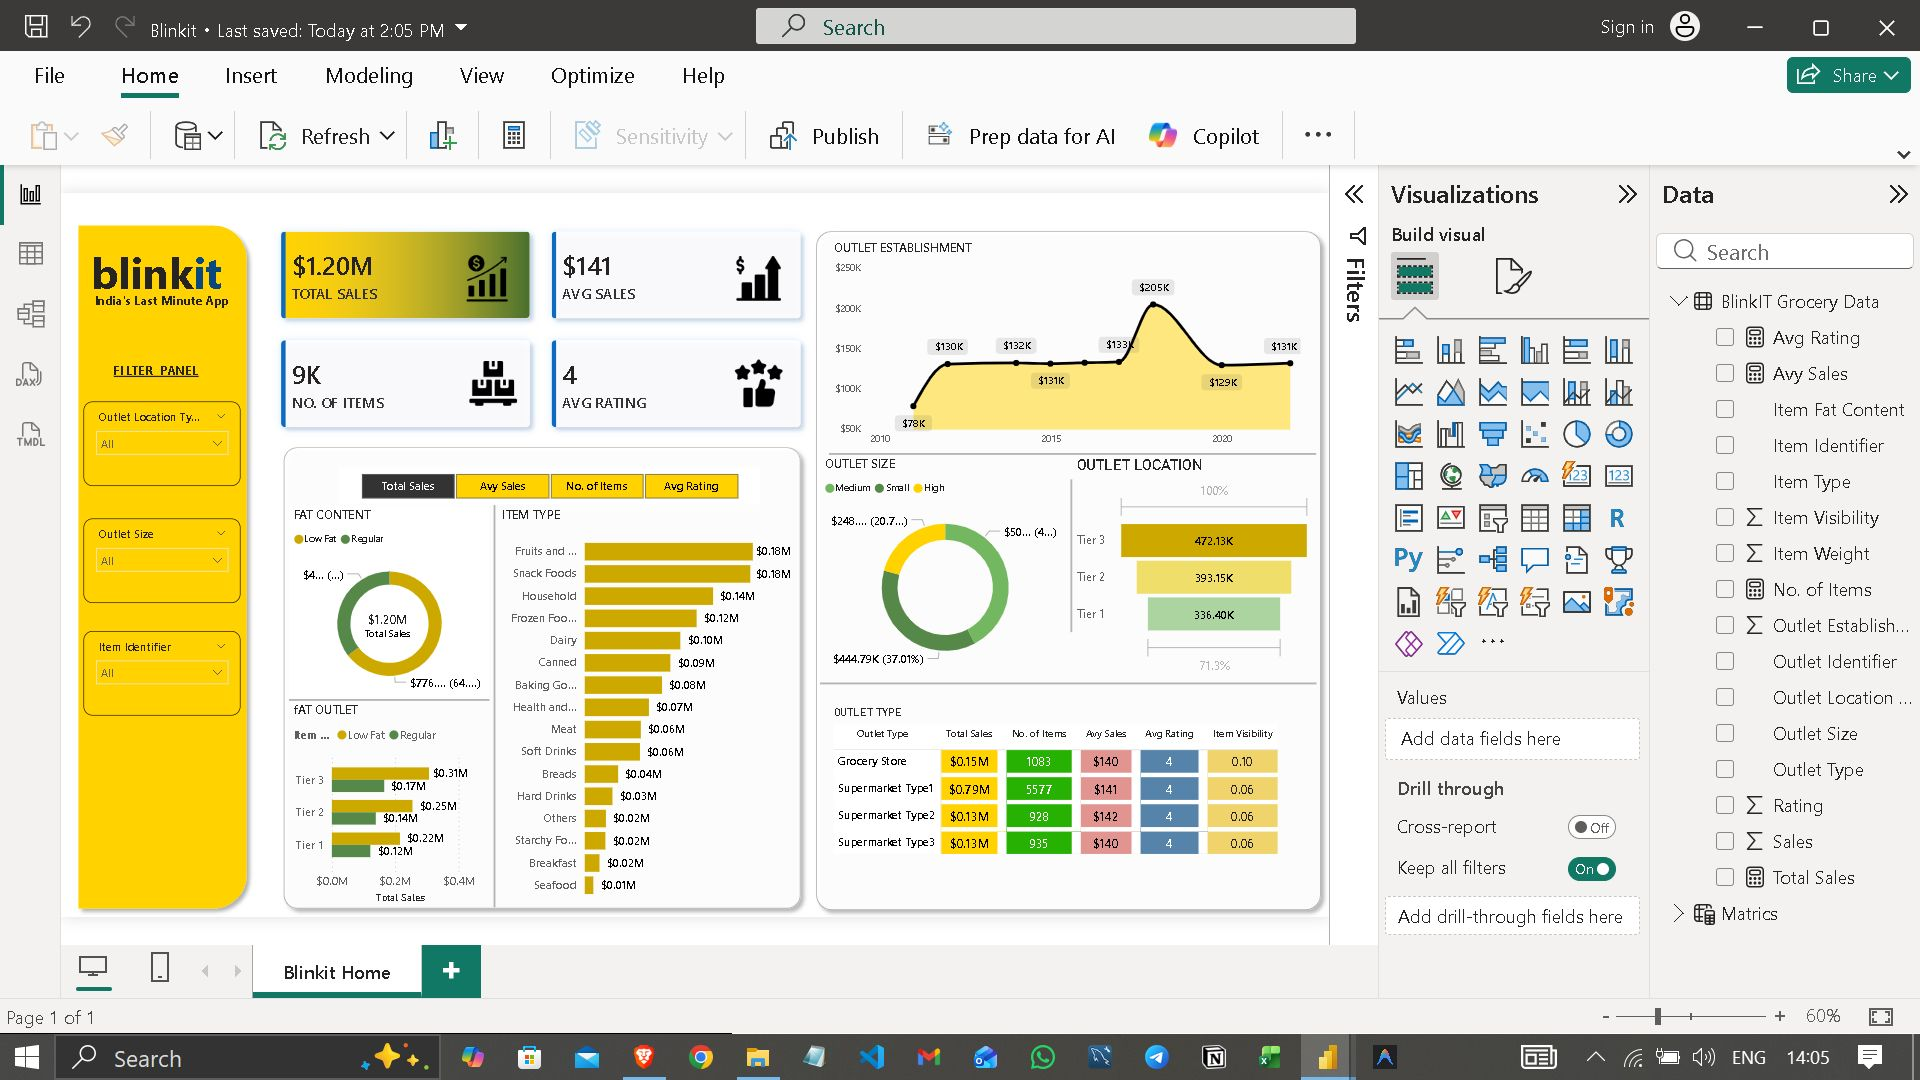
I analyzed ₹2.5Cr+ in simulated sales data across 20+ outlet types and 8 categories. I built over 10 DAX measures to calculate revenue growth, Average Order Value (AOV), outlet ranking, and category share.
The Result
The analysis highlighted that Tier-1 outlets (only 30% of total locations) drove over 45% of total revenue, and the top 5 outlets outsold the bottom 10 by a factor of 3x.